Beverage Case Study
Client Profile
High-volume beverage bottler.
Solutions
- Management Operating System
- Leader Training & Development
- Short Interval Controls
- Root Cause Analysis
- Shop Floor Situational Coaching
- Visual Management
- Centerlining
- Speed Accumulation Lost Time (SALT)
Challenge
- Daily Directional Setting Meetings (DDS) did not drive actions; they only reported the previous day’s results.
- Actions to address performance gaps were not well-defined or followed up on.
- Root cause analysis was not conducted effectively for the top sources of loss.
- Inexperienced supervisors managed their departments inconsistently across shifts.
- There was a lack of operational and maintenance leadership presence on the shop floor.
- Frequent microstops occurred across multiple assets on the filling/packaging line.
- Difficulties in executing packaging changeovers due to a lack of accurate set points on equipment.
- Machine speeds were adjusted based on operator preferences, not on established optimal settings.
Approach
- Coached effective meeting behaviors.
- Introduced Key Performance Indicators (KPIs) and their use in driving actions to address poor performance.
- Introduced and coached effective use of a formal Action Log.
- Designed and coached Leader Standard Work (LSW) for supervisors.
- Coached and audited the effective use of tools and behaviors.
- Introduced Visual Management tools.
- Performed deep cleaning of equipment.
- Restored equipment to technical baseline.
- Established clearly visible set points.
- Used the Action Log process to drive improvements in Speed Accumulation Lost Time (SALT).
- Installed tools to ensure the sustainability of equipment centerline condition.
Results
- DDS meetings now focus on performance gaps and generate actionable steps to address these gaps.
- KPIs cascade from the shop floor hourly results up to the site’s Profit & Loss (P&L).
- Supervisors manage consistently across shifts, utilizing LSW to ensure active supervision daily.
- Hour-by-hour visual boards track performance, changeover times, and GMP/housekeeping compliance.
- Reduced the average changeover time from over 40 minutes to under 25 minutes per changeover.
- Practically eliminated microstops due to turned cases of finished product (the top source of loss at the beginning of the project).
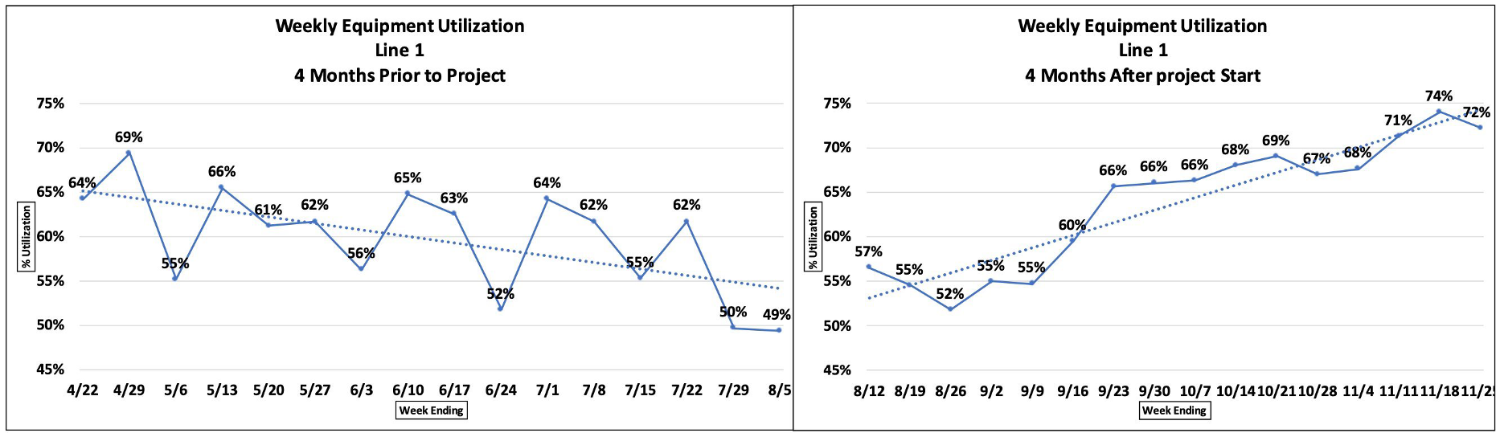
- Achieved a sustained 31% improvement in utilization for the target line (4-week rolling average).
- The variation in weekly equipment utilization was significantly reduced, improving overall uptime.
- Equipment Utilization increased from a baseline of 54% to a sustained 71%, as measured by a 4-week rolling average.
- Two months after the engagement, a record utilization of 90% was reached.